Abteilung Wasserressourcen und Trinkwasser
Wasserressourcen & Trinkwasser
Wir untersuchen die massgeblichen physikalischen und chemischen Prozesse in Grund-, Oberflächen- und Trinkwasser. Unsere Grundlagenforschung und angewandte Studien zu Wasserressourcen, ‑verschmutzung sowie ‑aufbereitung tragen wesentlich zur nachhaltigen Wassernutzung im nationalen und internationalen Kontext bei.
Publikationen
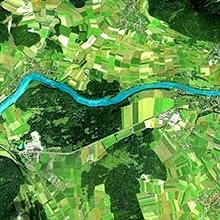
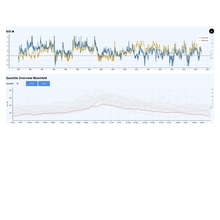
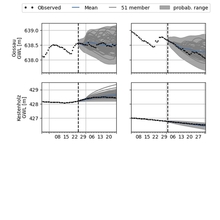
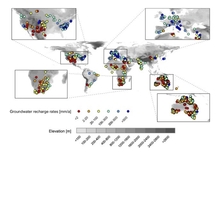
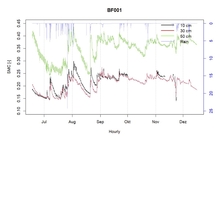
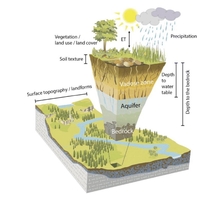
Bäthge, A., Vargas, C. R., Lischeid, G., Collenteur, R., Cuthbert, M., Fleckenstein, J., … Reinecke, R. (2026). A global-scale time series dataset for groundwater studies within the earth system. Scientific Data, 13, 401 (17 pp.). doi:10.1038/s41597-026-06966-1, Institutional Repository
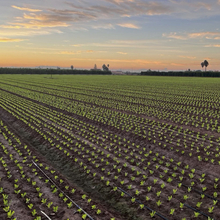
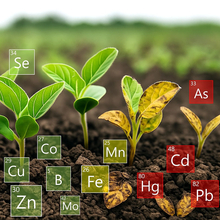
Siegenthaler, M. B., Winkel, L. H. E., Meuli, R. G., & Tolu, J. (2026). Organic selenium quality and quantity in soils are related to organic matter composition and driven by land use. Environmental Science and Technology, 60(10), 7897-7911. doi:10.1021/acs.est.5c15430, Institutional Repository
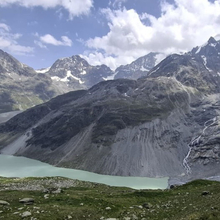
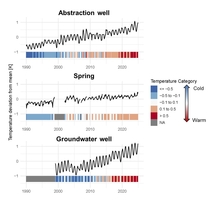
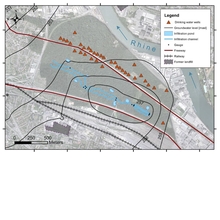
van Rooyen, J., Vennemann, T., Purtschert, R., Affolter Kast, A., Brennwald, M. S., Kipfer, R., & Schilling, O. S. (2026). Anthropogenic tritium as a continental-scale tracer in river-derived recharge. Nature Water. doi:10.1038/s44221-026-00616-x, Institutional Repository
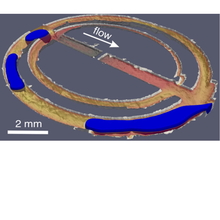
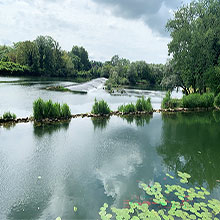
Rougé, V., Dax, A., Köster, O., von Gunten, U., & Janssen, E. M. L. (2026). Degradation of toxins and metabolites of cyanobacteria and micropollutants during biological sand filtration. Environmental Science and Technology, 60(12), 9647-9659. doi:10.1021/acs.est.5c16532, Institutional Repository
News