News Detail
Making assessments of grey water more consistent
March 9, 2017 |
In the early 2000s, to visualize the water resources required to produce food and other goods, the Dutch scientist Arjen Hoekstra created the concept of the “water footprint”: this measures the amount of water used in production and along the supply chain. One component of the water footprint is known as grey water – the amount of freshwater that is needed so that water contaminated in the production process is sufficiently diluted to meet the applicable quality standards (see Box). The grey water footprint, in other words, reflects the intensity of water pollution caused by production.
Choice of standards
In a study published in the Journal of Cleaner Production, Eawag scientists highlight the need for greater standardization in the assessment of the grey water footprint. Study leader Hong Yang of the Systems Analysis, Integrated Assessment and Modelling department explains: “Calculation of the grey water footprint is highly sensitive to, for instance, the water standards applied – the drinking water or the ambient water quality standard.” These standards also vary, she adds, from one country to another: for example, the limit specified for nitrogen in drinking water is 10 milligrams per litre (mg/l) in the US and China, 11.3 mg/l in the EU and 5.6 mg/l in Switzerland. For surface waters, the limit varies from 0.1–2.2 mg/l in the US and 1.0 mg/l in China to 5.6 mg/l in the EU and Switzerland. The concentrations permitted in surface waters are generally lower than in drinking water because aquatic organisms are more vulnerable to pollutants than humans.
The implications are clearly apparent from the scientists’ calculations of the grey water footprint for nitrogen pollution in maize production: using the drinking water standard of 10 mg/l, the global total grey water footprint is 706 trillion litres; if the ambient water standard of 3 mg/l is used, the volume increases to 2607 trillion litres. Yang says: “This means that the grey water footprint tends to be underestimated if the drinking water standard is adopted.” In addition, as she points out, limits are not specified for all pollutants or in all countries – a further obstacle to consistent assessments.
Integrating all relevant pollutants
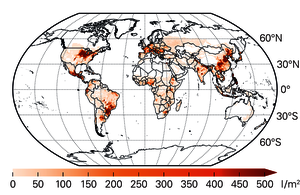
Another issue highlighted by the Eawag study is the integration of multiple pollutants. For example, assessments of the grey water footprint in maize production should include not only nitrogen but also phosphorus, pesticides and heavy metals. “But in fact,” says Yang, “the majority of assessments only consider nitrogen loads.” According to the study, if phosphorus pollution is included, the global grey water footprint in maize production rises to 7234 trillion litres (Fig. 2).
Yang and her co-workers also see room for optimisation with regard to the spatial resolution of assessments: “It can make a big difference whether assessments of pollution are based on the average situation for the whole watershed or on local (grid‑level) concentrations. Watershed-level concentrations can mask high levels of local pollution, understating the grey water component.” This also compromises assessments of regional water stress (i.e. degree of water scarcity, see Box). For example, the grey water stress caused by maize production along the Mississippi appears insignificant if it is assessed on the basis of average pollutant concentrations for the whole river basin. However, if concentrations are estimated at the grid level, many areas of high grey water stress are revealed within the watershed (Fig. 3). The authors recommend that the grey water footprint and grey water stress should be consistently assessed at the grid level, rather than on the basis of average concentrations across the river basin.
Fig. 2: The grey water footprint relating to nitrogen and phosphorus pollution in maize production. The assessment is based on ambient water quality standards of 3 mg/l for nitrogen and 0.15 mg/l for phosphorus.
Fig. 3: Grey water stress caused by maize production, assessed at the watershed (left) and the grid level (right). Nitrogen and phosphorus pollution were taken into consideration. 0 indicates the absence of grey water stress, while values greater than 1 indicate areas where available freshwater resources are not sufficient to ensure that ambient water quality standards are met.
Yang concludes: “Grey water footprints and the associated grey water stress values for different products and regions will only really be comparable if standardised methods are adopted. This is essential if these indicators are to provide a basis for sound policymaking on water resource management.”
Water footprint and water stress
The water footprint is a measure of the volume of water consumed and/or polluted along the production and supply chain of a product. It indicates the proportions sourced from surface or groundwater (blue water) and precipitation (green water) and the amount of freshwater required to assimilate pollutants so that specific water quality standards are met (grey water). For example, according to the Water Footprint Network, the production of one kilogramme of beef requires approx. 15 thousand litres of water (4% blue, 93% green, 3% grey water; global average). The production of a cotton T-shirt requires, on average, around 2500 litres (33% blue, 54% green, 13% grey water). However, depending on the production conditions in a particular area, regional water footprints can differ substantially from the global average.
Also crucial – apart from the amount of water required for production – is the amount available over the long term. If the water footprint exceeds available water resources, then production is not sustainable. The degree of water scarcity, defined as the ratio of demand to availability, is known as water stress. For example, if grey water stress is greater than 1, the freshwater resources available are not sufficient to ensure that the required water quality standards are met.


